Customer Service Performance Metrics That Matter

Customer service performance metrics are the numbers that tell you whether your support is fast, whether it actually solves the problem, and whether people leave happy. The ones worth your attention are customer satisfaction, first contact resolution, first response time, and cost per contact. Track those four well and you know more than most teams drowning in twenty dashboards. Everything below explains what each one means, how it’s calculated, roughly where a healthy number lands, and the AI-support metrics that the older lists never mention.
What are customer service performance metrics?
Customer service performance metrics are measurements of how well your support team resolves customer problems and how customers feel about the experience. They fall into two rough camps that answer different questions. Operational metrics measure the work itself, so things like how fast you reply and how often you fix an issue on the first try. Experience metrics measure how the customer felt about it, so satisfaction and loyalty. You need both, because a team can be fast and still leave people annoyed, and a team can be loved while quietly burning money on every ticket.
Most published lists hand you ten or fifteen of these and call it a day, which is the wrong instinct. A metric only earns its place if a bad reading would change what you do next week. If nobody would act on a number, it’s decoration, and you should drop it rather than build a chart around it.
Which customer service metrics actually matter?
Four metrics carry most of the weight for a small or mid-sized support team: customer satisfaction, first contact resolution, first response time, and cost per contact. They cover the three things that matter, which are quality, speed, and money, without asking you to babysit a wall of numbers. Here’s the short version, and the rest of the article walks through each one properly.
| Metric | What it tells you | A sensible starting target |
|---|---|---|
| Customer satisfaction (CSAT) | Whether people were happy with the help they got | Low 80s percent and climbing |
| First contact resolution | How often you solve it in one go | Around 70 percent or better |
| First response time | How long people wait for a first reply | Under an hour on live channels |
| Cost per contact | What each conversation actually costs you | Know it first, then drive it down |
Treat those targets as orienting rules of thumb rather than laws. A premium product with complex tickets will sit lower on resolution and that can be fine, while a simple app should expect better. The point of a target is to tell you which direction to push, not to hand you a grade.
How do you measure customer satisfaction, NPS, and effort?
You measure satisfaction by asking, right after an interaction, and turning the answers into a single percentage. Customer satisfaction, usually written as CSAT, is the workhorse here. You send a short survey after a conversation closes, ask people to rate the help, and calculate it as the number of positive ratings divided by the total number of responses, times one hundred. If seventy people out of eighty rate you well, your CSAT is about 88 percent. A reading in the low 80s and up is generally seen as healthy, and the trend matters more than any single week.
Two cousins sit next to CSAT and answer slightly different questions. Net Promoter Score, or NPS, asks how likely someone is to recommend you on a zero to ten scale, then subtracts the percentage of detractors from the percentage of promoters, so it measures loyalty to the whole company rather than one ticket. Customer Effort Score, or CES, asks how easy it was to get the problem sorted, and it’s the sharpest predictor of whether someone will stick around, because people forgive a lot but they don’t forgive being made to work. If you only run one survey, run CSAT. If you can run two, add CES, because a low effort score often explains a satisfaction dip before the satisfaction number even moves.
How fast and how completely are you resolving issues?
Speed and completeness are two separate questions, and you need a metric for each. First response time measures how long a customer waits before a human or agent replies for the first time, calculated as the average gap between when a request arrives and when the first reply goes out. Fast matters because the wait is the part people remember, and the acceptable wait depends heavily on the channel. Qualtrics suggests targets in the region of an instant reply on live chat, a few minutes on the phone, around an hour on social, and up to a day on email, which is a reasonable map to start from.

Speed alone can lie to you, though, which is where resolution metrics come in. First contact resolution is the share of issues you solve in a single interaction, without the customer having to come back, and you calculate it as issues resolved on first contact divided by total issues, times one hundred. It’s arguably the most honest quality metric you have, because a high figure means people are actually getting answers rather than getting passed around. Around 70 percent is a common line for good, though complex products land lower for legitimate reasons. Alongside it, average resolution time tells you how long a fix takes end to end, and ticket reopens tell you how often a “solved” issue wasn’t really solved. A team can post a beautiful first response time and still frustrate everyone if half of those fast replies resolve nothing, so always read speed and resolution together rather than celebrating one on its own.
What does each customer conversation actually cost you?
Cost per contact is the total you spend on support divided by the number of conversations you handle, and almost nobody outside finance can quote theirs. That’s a shame, because it’s the metric that turns support from a black box into something you can reason about. When you know a contact costs, say, four dollars all in, a change that deflects a thousand repetitive questions a month stops being a vague “efficiency win” and becomes a number you can put next to the cost of building it. Cost per contact also keeps the other metrics honest, because you can chase a perfect satisfaction score straight into a budget hole, and this is the number that tells you when you’ve gone too far.
The reason this metric gets ignored is that it’s genuinely hard to pin down with traditional tooling, since agent salaries, tool licenses, and the AI bill all live in different places. AI support changes that math in a specific way. When your agent answers routine questions, the marginal cost of a conversation drops toward the cost of the tokens the model burned, which for a typical exchange is cents rather than dollars. We wrote about the gap between what a resolution costs and what most tools charge for it in the true cost of AI support, and if you want to put your own volume and resolution rate into it, the savings calculator does the arithmetic. The point for this article is narrower: if you’re not measuring cost per contact, you’re flying without the one gauge that tells you whether an efficiency effort actually paid off.
Which metrics change when an AI agent answers first?
When an AI agent handles the front line, three new metrics become the ones you watch, and none of them appear on the classic top-ten lists. The first is automated resolution rate, sometimes called containment, which is the share of conversations the agent closes on its own without ever handing off to a person. You calculate it as conversations resolved by the agent divided by total agent conversations, times one hundred, and it’s the single clearest read on whether your automation is pulling real weight or just greeting people before a human does the work anyway.
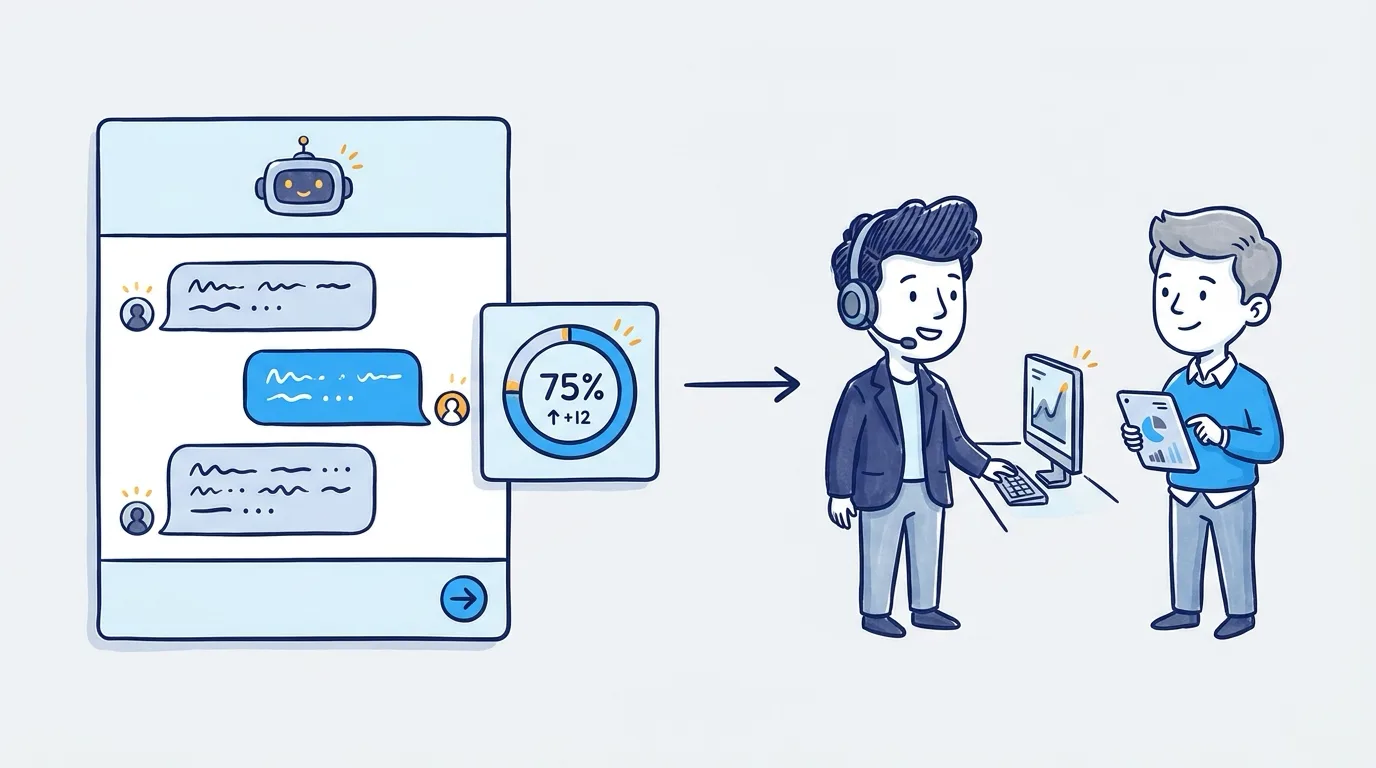
The second is escalation rate, or handoff rate, which is the share of conversations the agent passes to a human, and it’s the mirror image of containment. A healthy handoff isn’t a failure, because some questions genuinely need a person, and a good agent should escalate those cleanly with the full chat history attached so nobody has to repeat themselves. What you’re watching for is the pattern: a handoff rate that climbs on a specific topic is telling you exactly where your help content or your workflow has a hole. The third metric is the AI version of cost per contact, and it’s where bring-your-own-AI setups get interesting, because when you connect your own provider account you can see what each automated conversation actually cost in tokens rather than guessing. That visibility is the whole reason we built Optlo around your own provider key instead of a bundled per-resolution price. You can even route the cheap questions to a small fast model and save the capable model for the hard ones, which changes your cost per resolution directly. If you want to try that shape of setup, you can connect your own AI account with no credit card required and watch these numbers for yourself.
One trap is worth naming before you lean on these numbers. Don’t judge an AI agent only on containment, because an agent that closes everything by stubbornly refusing to escalate will post a gorgeous automated resolution rate and a quietly falling satisfaction score. Read containment, escalation, and CSAT on the automated conversations together, the same way you read speed and resolution together for humans. The number that matters is happy customers resolved without a human, not conversations the agent simply declined to hand off.
How many customer service metrics should you actually track?
Track four to six metrics closely and let the rest sit in a report you glance at monthly. A support lead who watches satisfaction, first contact resolution, first response time, and cost per contact, plus containment and escalation once an AI agent is in the mix, has a genuinely complete picture and enough attention left over to act on it. The failure mode isn’t tracking too little, it’s tracking so much that no single number ever feels urgent enough to fix.
The metrics to be suspicious of are the ones that look busy but drive no decisions. Total tickets handled rewards volume over resolution and quietly punishes the team that deflects repetitive questions well. Average handle time is worse, because pushing agents to close conversations faster is a reliable way to tank both first contact resolution and satisfaction at the same time. Neither is useless, but neither belongs on the wall where your team sees it every day, because a metric on the wall becomes a target, and a target that rewards the wrong behavior will get you exactly that behavior. Pick the few numbers that would actually change your plan, watch those, and give yourself permission to ignore the rest.
Frequently asked questions
What are the most important customer service performance metrics?
The most important customer service performance metrics for most teams are customer satisfaction, first contact resolution, first response time, and cost per contact. Together they cover quality, speed, and money without overwhelming you. Once an AI agent handles part of your volume, add automated resolution rate and escalation rate so you can see how much the automation resolves on its own and how cleanly it hands off the rest.
What’s a good CSAT score?
A customer satisfaction score in the low 80s percent and up is generally considered healthy, though the right target depends on your product and your customers. What matters more than hitting a specific number is the direction of travel, so a score climbing from 78 to 84 over a quarter is a better sign than a flat 88. Read it alongside customer effort score, since rising effort often predicts a satisfaction dip before the satisfaction number itself moves.
What’s the difference between a metric and a KPI?
A metric is any number you can measure, while a key performance indicator, or KPI, is the small set of metrics you’ve decided actually reflect success for your team. Every KPI is a metric, but most metrics shouldn’t be KPIs. The practical test is whether a bad reading would change what you do, because if it wouldn’t, it’s a metric worth logging but not one worth watching daily.
How do you measure the quality of AI customer support?
You measure AI customer support quality with the same experience metrics you use for humans, mainly customer satisfaction on the automated conversations, plus two automation-specific numbers. Automated resolution rate shows how often the agent closes an issue without a human, and escalation rate shows how often and where it hands off. Reading satisfaction and containment together stops you from rewarding an agent that refuses to escalate, since the goal is happy customers resolved without a person, not conversations simply kept away from your team.
How often should you review customer service metrics?
Review your core metrics weekly and your fuller report monthly. Weekly is frequent enough to catch a first response time that’s slipping or a topic driving a spike in escalations, while monthly gives satisfaction and resolution trends enough data to mean something. Reacting to daily wobbles usually creates more noise than signal, so save the deep look for a steadier cadence.